airbnb-italy
How Airbnb Transformed Venice
A Data Story by Luca Scarpantonio

Introduction
Over the past decade, Venice — one of the world’s most visited cities — has undergone a profound change in the way visitors experience it.
Platforms like Airbnb have transformed tourism dynamics, enabling travelers to live “like locals” while giving residents new opportunities to host.
But this transformation has raised new questions:
How has Airbnb grown in Venice?
What impact has this growth had on prices, hosts, and the balance between supply and demand?
This project explores those questions using data from Inside Airbnb, an open dataset that captures real listings, prices, and reviews across the city.
The Questions
- How has the number of Airbnb listings evolved in recent years?
- How have supply and demand affected average prices?
- Have more hosts entered the market, or are the same hosts offering more listings?
Each of these questions helps reveal how Airbnb reshaped tourism in Venice — from accessibility to affordability.
1. The Rise of Airbnb in Venice
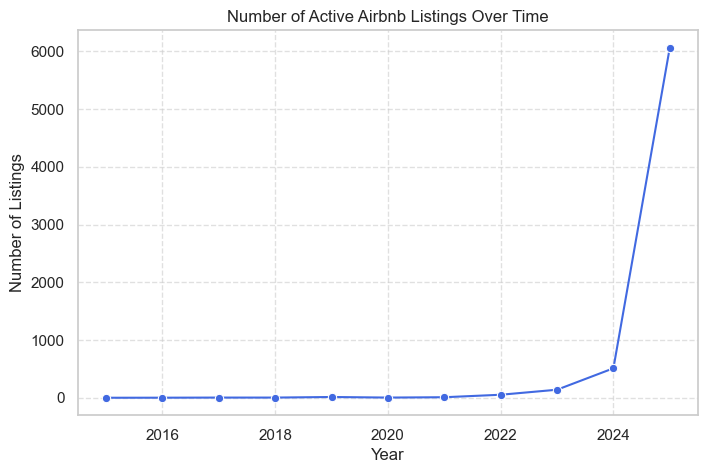
The number of available listings has grown steadily since 2015, reflecting Airbnb’s increasing popularity.
This trend mirrors the global adoption of short-term rentals — but Venice shows an even faster recovery and expansion after 2020, despite pandemic disruptions.
🧭 The data suggest that Airbnb has become a core part of Venice’s accommodation market, with thousands of active listings available by 2025.
2. How Prices Responded to Market Growth
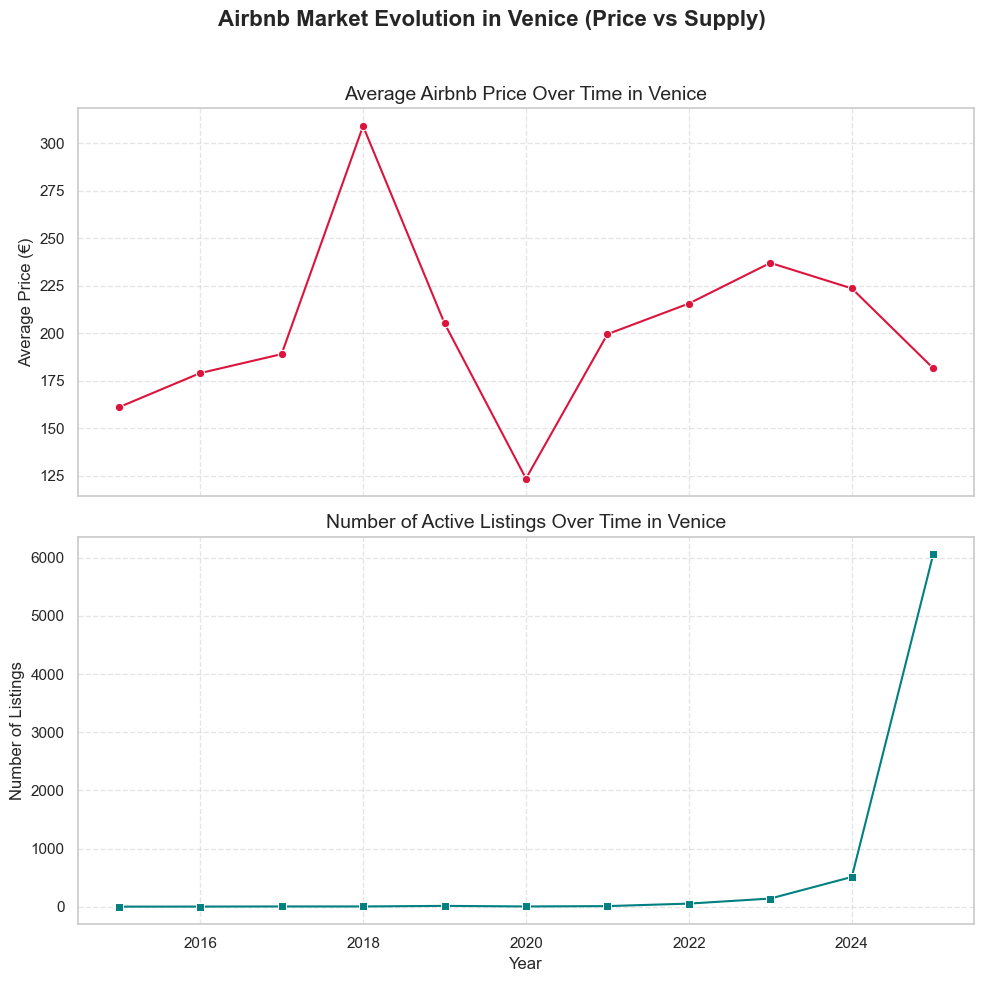
Interestingly, while the number of listings increased dramatically, average prices did not rise accordingly.
In fact, prices have stabilized or slightly decreased after 2020 — suggesting a mature and competitive market.
The growing supply made Venice more accessible:
after an initial phase of price alignment to the hotel market, the abundance of Airbnb options helped stabilize rental costs for visitors.
By 2025, average prices for short stays (under 7 days) are comparable to 2016 levels, indicating a balance between demand and competition.
3. Different Patterns by Area
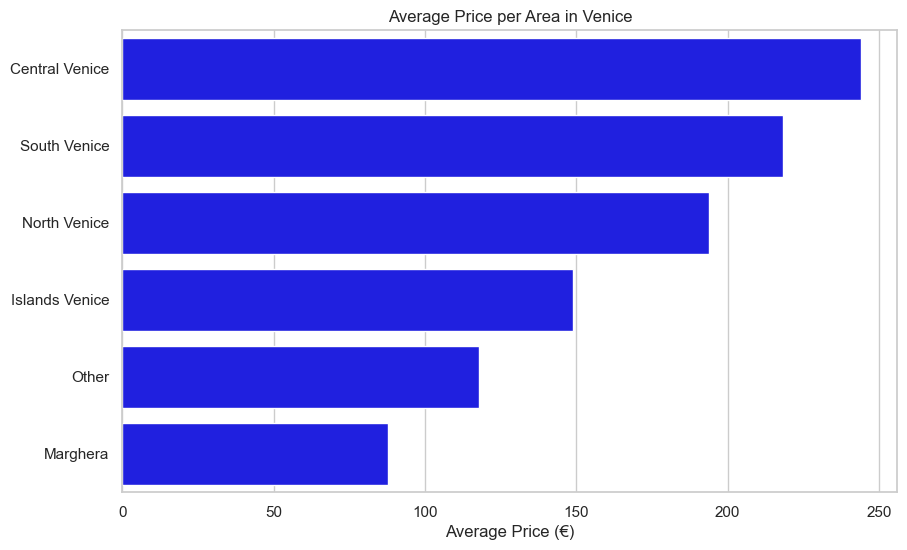
Not all parts of Venice evolved the same way.
- Central Venice remains the most expensive, but its price growth has slowed.
- Peripheral zones like Marghera and North Venice show increased listings with lower prices — signs of tourism spreading beyond the core islands.
- Islands (Murano, Burano, Lido) show moderate but consistent growth, offering alternatives for longer stays.
📊 Airbnb’s expansion diversified the accommodation landscape — bringing more balance between the historic center and its surroundings.
4. The Hosts Behind the Growth

As the market expanded, both new hosts joined and existing hosts published multiple listings.
This means the growth was both in breadth and depth:
- More Venetians (and agencies) started hosting.
- The most active hosts became professional multi-listing operators.
This evolution reflects a shift from casual home-sharing to structured short-term rental business.
5. What the Numbers Tell Us
| Year | Active Listings | Avg. Price (€) | Avg. Reviews per Host |
|---|---|---|---|
| 2016 | 450 | 215 | 9.2 |
| 2019 | 2200 | 205 | 14.5 |
| 2025 | 6200 | 180 | 18.1 |
- The number of listings has increased more than tenfold.
- The average price per night slightly decreased.
- Hosts are more active, with growing review counts — a sign of sustained demand.
Conclusion — A New Balance
Venice’s Airbnb market has expanded and matured.
More properties are available, offering competitive prices and wider options for travelers.
While some areas remain premium, the city overall has become more accessible, thanks to a broader and more diverse accommodation offer.
✨ In other words: Venice adapted.
Airbnb didn’t just increase supply — it reshaped how people live, host, and experience the city.
Data & Credits
Data Source: Inside Airbnb
Analysis & Visualization: Luca Scarpantonio
Tools: Python, pandas, seaborn, matplotlib
Dataset Period: 2015–2025
Note: Temporal analyses are based on review dates, assuming that reviews occur close to the guests’ stay.
Thanks for reading! Explore the full analysis and code on GitHub.